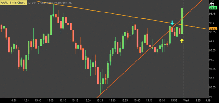
This ThinkScript for ThinkorSwim will plot automatic trend lines for the prevailing trend based upon calculating second-order pivots. This uses the top-down, bottom-up approach to trend lines. That is to say, it connects lower-highs for down trends and higher-lows for up trends.
- Another great indicator released by Robert. I just purchased the Automatic Trend Channels. It's badass.
This works on any time-frame and will plot the appropriate trend. Breakouts / breakdowns are indicated with an arrow. An audible alert may, optionally, be triggered as well.
The trend lines may be drawn from the candle wicks or the candle bodies.
The trend line may be extended to the left by a user-definable amount.
Combine the auto-trend line and basic market structure with auto-fibonacci scripts (available as a separate purchase) for a powerful combination.
Update
Thank you to the initial users who purchased this script and provided valuable feedback to me. Because trend lines that were established in the past may become significant once again, the ability to keep those trend lines on screen was requested several times, so I have added that feature.
The script will now plot between 1 and 10 trend lines at a time.
I have added the ability to limit the right extension of the trend line (instead of just continuing forever).
 Loading... Please wait...


