Loading... Please wait...


The advanced market forecast indicator simplifies the powerful MFI ThinkorSwim indicator by automatically identifying complex signals.
Your scripts have helped many of us simplify our daily process and provide quicker more accurate signals.
Advanced Market Forecast Indicator
Making a powerful, but complicated, indicator simple to use
Hi Robert…
in my online classes at investools some trend trade coaches use the Market Forecast indicator to help identify strength or weakness in trends. It has 3 lines that oscillate between 0 and 100. the 3 lines indicate 3 separate time frames: intermediate line = 1–3 months, near-term line = 5–15 days, and momentum line = 1–5 days and tend to indicate oversold or overbought levels.
there is a signal people use with it called the near-term divergence which works similar to the macd divergence. the concept is price and the near-term line (shown as blue line below) are diverging or converging. they read it by peaks (or valleys) on the near-term line as it matches up with price action, just like a macd. when a divergence or convergence forms, the idea is to walk backwards on the blue line to find the valley between the peaks (or peak between the valleys) and line that day up with price action. you draw a line from that price day close (shown below in cyan) and you watch to see if price breaks that line, if it does its a warning signal that price may continue to fall further to next support level below (or rise to next resistance level above). this creates the bullish or bearish near-term divergence signal.
i’ve reached out to other coders to ask if they could come up with a thinkscript for this signal, and they said it would be too difficult as it would involve counting backwards on the blue line an undetermined amount of days to search for the previous peak (or previous valley).
would you consider creating a script for me that could identify this signal? or is it really impossible or just too difficult like they said?
Was this difficult? Yes. Was it impossible? No.
The “Market Forecast” indicator is a proprietary Investools indicator that is available only on the ThinkorSwim platform. It is an oscillator that ranges between zero and 100, similar to stochastic and RSI. It works well with indices, futures, currencies, broad-based ETFs, and less-volatile large-cap stocks. It shows multiple time frames on a single chart.
The indicator is very nuanced and can provide a number of valuable signals if read properly. Unfortunately, with so much information being displayed at once, signals may be overlooked and opportunities missed as a result.

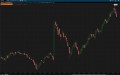
Default Market Forecast Indicator for ThinkorSwim
My Advanced Market Forecast ThinkScript builds on the built-in indicator and automates the identification of several different signals.
Market Posture
The first signal, market posture, is derived from the intermediate line. It indicates the intermediate-term trend’s direction (bearish or bullish) and strength (weak, strengthening, strong).

Market posture strength meter

ThinkScript: Advanced Market Forecast—Market Posture
Clusters
Clusters occur when Momentum, Near Term, and Intermediate lines are all in the overbought / oversold area at the same time. This is an indication of price being overextended and poised for a pull back or reversal.
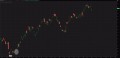
Bearish and bullish clusters, along with their respective confirmation price levels, are automatically identified and marked on the chart.

ThinkScript: Advanced Market Forecast—Bearish Cluster

ThinkScript: Advanced Market Forecast—Bullish Cluster
Each element used to indicate a cluster formation my be individually enabled or disabled on both the upper and lower portions of the chart via a simple toggle within the script settings panel.

ThinkScript: Advanced Market Forecast—Identifying Clusters
For more information on cluster signals, refer to this ShadowTrader PIP Academy articleor this article from TDAmeritrade.
Near-Term Divergence
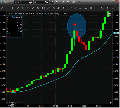
A near-term divergence occurs when there is a divergence between the blue, near-term line and price action. A bearish divergence divergence occurs when price makes higher highs and the oscillator makes lower highs indicating price is overbought and due for a correction. The opposite holds true for bullish divergences.
Bullish and bearish near-term divergences are automatically identified and marked on the chart. Short-term trend lines are drawn on the charts in the same manner they would be if the chartist were manually identifying these patterns.
The divergence is confirmed when price closes above / below the respective confirmation line.

ThinkScript: Advanced Market Forecast—Show all divergences
In order to minimize chart clutter, the user may elect to show only the most recent divergence rather than all divergences. Regardless of whether only one or all divergences are being shown, the most recent divergence will always be highlighted in order to bring it to the user’s attention. Once again, this is easily accomplished via a toggle in the script’s settings panel.

ThinkScript: Advanced Market Forecast—Show only the most recent divergence
For more information on near-term divergence signals, refer to this ShadowTrader PIP Academy article.
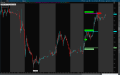
Intermediate Confirmation
The intermediate confirmation signal occurs when the momentum and intermediate lines are at opposite extremes (that is one is oversold while the other is overbought). It is a trend continuation signal and is the weakest of the four signals derived from the Market Forecast indicator.
By default, intermediate confirmation signals are not shown. However, they may be enabled from within the script settings panel.
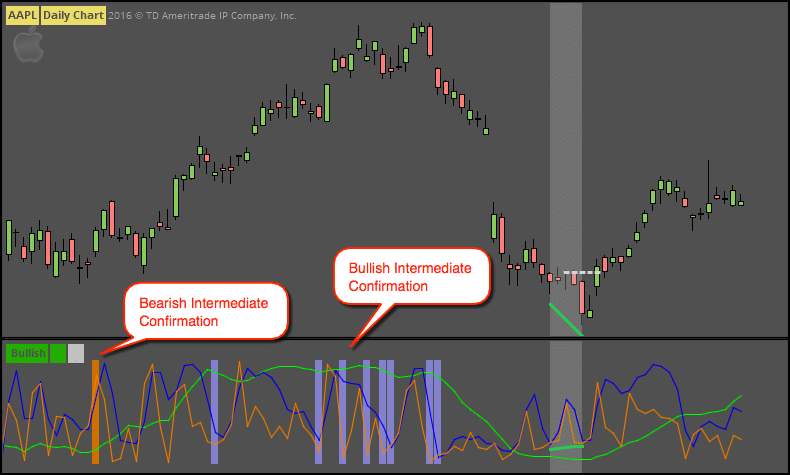
ThinkScript: Advanced Market Forecast—Intermediate Confirmation

ThinkScript: Advanced Market Forecast—Video Clip
For more information on intermediate confirmation signals, refer to this ShadowTrader PIP Academy article.