 Loading... Please wait...
- Home
-
MEGA LIST
- MEGA List Page
- BetterTrades
- CyberTrade University
- ForexMentor
- FXTE
- HUBB Financial Group
- Investools
- John Carter SimplerOptions
- Kaplan Schweser
- Online Trading Academy
- Optionetics
- OptionsUniversity
- Pristine
- Profits Run, Inc.
- ProfitStrategies
- TradetheMarkets
- Categories
- All Brands
- Trading Books
- AdvancedGET
- MetaStock
- MetaStock Add-ons
- MetaStock Plug-Ins
- MetaStock Utilities
- MetaTrader
- MetaTrader EA
- MetaTrader EA (Forex)
- NinjaTrader
- Statistical Analysis
- TradeStation
- TradeStation Add-Ons
- Trading Software
- Betting Exchange Software
- Mega Page - New Stuff
- Personal Development Courses
- More MEGA LIST
- Books
- More Books
- Mega List #1
- Mega List #2
- Mega List #3
- Real Estate
- Course by Category #1
- Course by Category #2
- Course by Author #1
- Course by Author #2
- Course by Author #3
- Course by Author #4
- RosettaStone
- Mega Page - 0
- Mega Page - A
- Mega Page - B
- Mega Page - C
- Mega Page - D
- Mega Page - E
- Mega Page - F
- Mega Page - G
- Mega Page - H
- Mega Page - I
- Mega Page - J
- Mega Page - K
- Mega Page - L
- Mega Page - M
- Mega Page - N
- Mega Page - O
- Mega Page - P
- Mega Page - Q
- Mega Page - R
- Mega Page - S
- Mega Page - T
- Mega Page - U
- Mega Page - V
- Mega Page - W
- Mega Page - X
- Mega Page - Y
- Mega Page - Z
- dvd
- estore
- libr
- shop
- store
- DOWNLOAD
- ECOMASTERS
- COST SHARING
- PAYMENT
- CONTACT US
- TC4S VAULT
- DOWNLOAD SUBSCRIPTION
Categories
- Home
- MORE COURSES FOR DOWNLOAD
- Day Trading Sub Panel Indicator ThinkorSwim TOS Script
Product Description
Day Trading Sub Panel Indicator ThinkorSwim TOS Script
The NYSE TICK indicator is commonly used to gauge the overall trend for NYSE stocks, but also other equity markets. It represents the number of stocks ticking up minus the number of stocks ticking down on the NYSE. For example, if the TICK reads +200, then 200 more stocks on the NYSE are ticking up then are ticking down. This is a bullish signal. If the TICK should read -354, then we understand that 354 more stocks are ticking down then are ticking up. This is a bearish signal.
If you’re an intra-day user of the NYSE TICK— a powerful market internal—you must also account for current market volatility in your trading decisions. If you don’t, you’re likely to get in trouble.
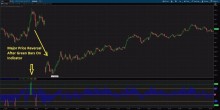
The TICK Sub Panel is designed as a quick reference tool for day traders who typically trade index funds, index fund futures, as well as market-correlated stocks such as AAPL,NFLX, TSLA, FB, TWTR, MSFT, SBUX, etc. This study will display the TICK directly under your price chart allowing you to follow crucial market conditions and respond to extreme TICK readings at a moment’s notice.
The easy to read user interface will automatically mark bars green when they reach extreme TICK readings of +800 or -800 giving traders more time to react to anticipated market reversions in price. The indicator also displays a clear yellow line at the +600 and -600 TICK levels in order to give traders an early warning of a possible extreme TICK reading in the very near future.
Works with ALL Futures,Forex Currency Pairs, and Stocks
Works with the ThinkOrSwim trading platform
Download link will be emailed upon purchase of the software


