Loading... Please wait...
- Home
-
MEGA LIST
- MEGA List Page
- BetterTrades
- CyberTrade University
- ForexMentor
- FXTE
- HUBB Financial Group
- Investools
- John Carter SimplerOptions
- Kaplan Schweser
- Online Trading Academy
- Optionetics
- OptionsUniversity
- Pristine
- Profits Run, Inc.
- ProfitStrategies
- TradetheMarkets
- Categories
- All Brands
- Trading Books
- AdvancedGET
- MetaStock
- MetaStock Add-ons
- MetaStock Plug-Ins
- MetaStock Utilities
- MetaTrader
- MetaTrader EA
- MetaTrader EA (Forex)
- NinjaTrader
- Statistical Analysis
- TradeStation
- TradeStation Add-Ons
- Trading Software
- Betting Exchange Software
- Mega Page - New Stuff
- Personal Development Courses
- More MEGA LIST
- Books
- More Books
- Mega List #1
- Mega List #2
- Mega List #3
- Real Estate
- Course by Category #1
- Course by Category #2
- Course by Author #1
- Course by Author #2
- Course by Author #3
- Course by Author #4
- RosettaStone
- Mega Page - 0
- Mega Page - A
- Mega Page - B
- Mega Page - C
- Mega Page - D
- Mega Page - E
- Mega Page - F
- Mega Page - G
- Mega Page - H
- Mega Page - I
- Mega Page - J
- Mega Page - K
- Mega Page - L
- Mega Page - M
- Mega Page - N
- Mega Page - O
- Mega Page - P
- Mega Page - Q
- Mega Page - R
- Mega Page - S
- Mega Page - T
- Mega Page - U
- Mega Page - V
- Mega Page - W
- Mega Page - X
- Mega Page - Y
- Mega Page - Z
- dvd
- estore
- libr
- shop
- store
- DOWNLOAD
- ECOMASTERS
- COST SHARING
- PAYMENT
- CONTACT US
- TC4S VAULT
- DOWNLOAD SUBSCRIPTION
Categories


- Home
- MORE COURSES FOR DOWNLOAD
- vBox Indicator

Product Description
A method by which to use volume to determine significant areas of support / resistance on intra-day charts.
Volume is an important indicator of market sentimentality and may be used as a tool to determine potential areas of support and resistance.
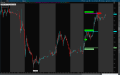
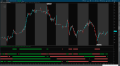
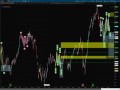
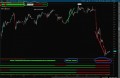
The trading day is divided into three sessions: morning (0930 – 1100), mid-day (1100 – 1400), and afternoon (1400 – 1600). The highest 5-minute volume in each session defines the greatest area of market interest and will show areas of significant support / resistance.
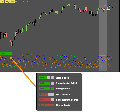
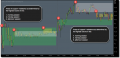
This indicator will work on 5 minute charts or below. The green boxes show the major areas from the morning session; gray boxes are from the mid-day session; and yellow boxes are from the late-afternoon session. The gray lines show the major support / resistance areas from the previous day.
The session colors may be adjusted from within the “Globals” section of the script settings panel.
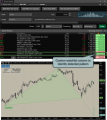
The extension lines showing the areas of support / resistance from the prior day’s trading session may be enabled or disabled from within the script settings pane as well.
Note: This does not include the custom volume script.
This vBox indicator is for ThinkorSwim only