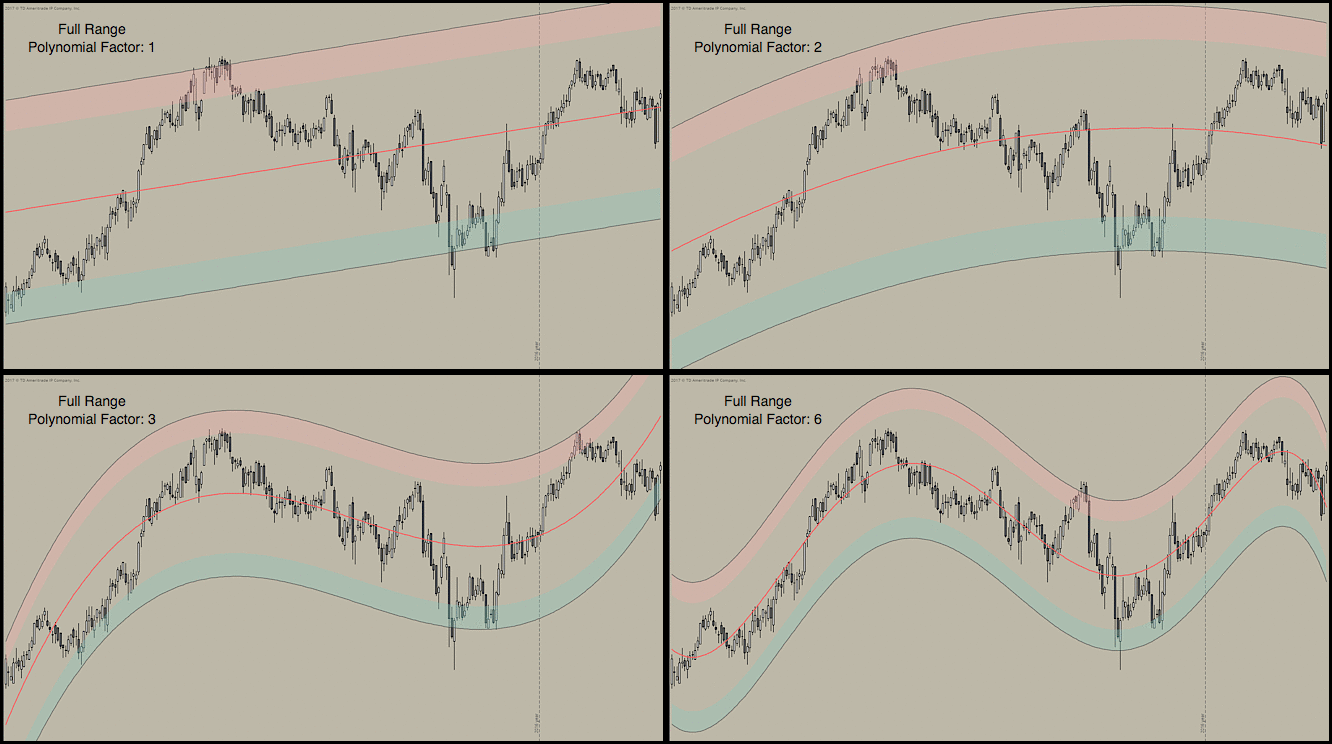
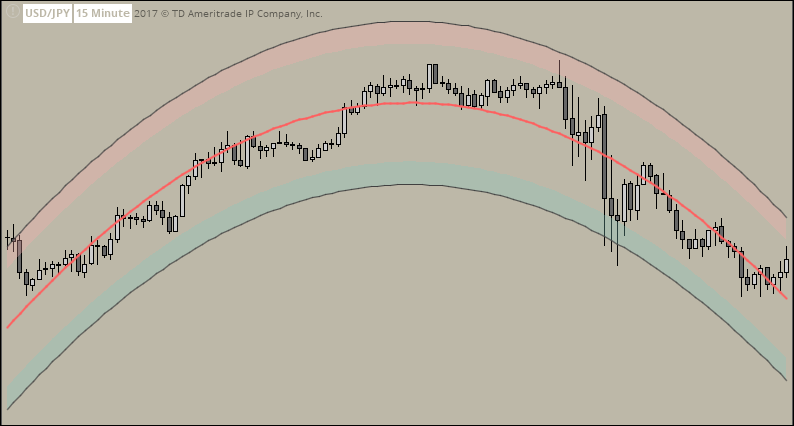
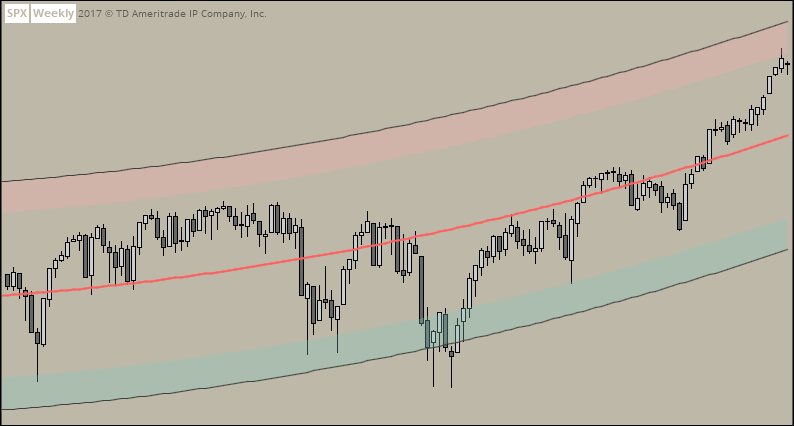
This indicator will automatically curve-fit a polynomial regression channel. The user may select any polynomial factor between 1 (a straight line) and 6 (a complex curve).
- I recently purchased the Polynomial Regression Channel and Sniper Trend studies and applied them to 5 minute charts for day trading purposes. In the first week, I have had great success using these studies.
I am really finding both studies useful and profitable.
Robert’s Regressions
aka The finest polynomial regression channel available for ThinkorSwim
I was wondering if you might want to attempt coding a Polynomial Regression Channel for Thinkorswim. I’m a huge believer in channel trading, but there has been nothing adequate coded for TOS to date. There are some poorly coded pseudo-channels on the net, but they are copies of each other and they have the same flaws.
This was a fun, although very challenging, project. I needed to study up on linear algebra so that I could understand the math involved. Then, because ThinkScript does not support arrays, matrices, or easily storing data for future reference, I had to devise creative work-arounds to handle the advanced algorithms required by this indicator.
This indicator will automatically curve-fit a polynomial regression channel. The user may select any polynomial factor between 1 (a straight line) and 6.
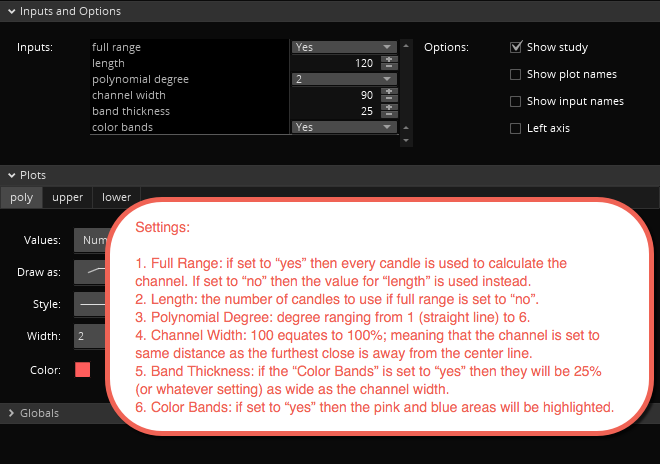
The user may adjust the length of the channel as desired from within the settings panel.
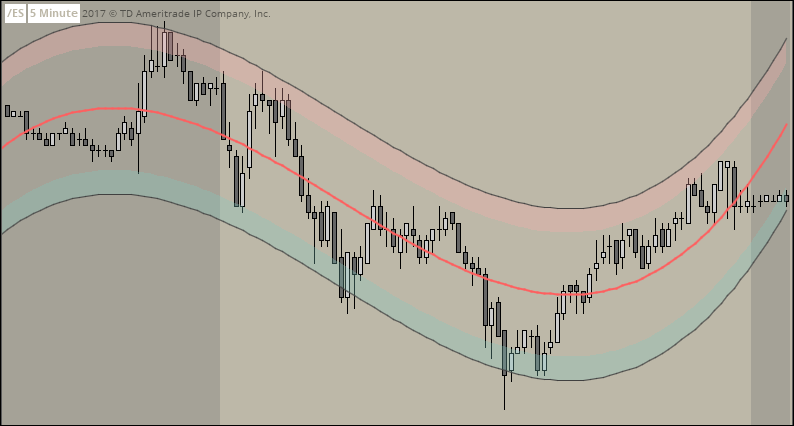
This indicator will work on any instrument and on any time frame. Some examples are below.
Questions
Was this made with a T3 Moving Average or a Centered TMA with an extrapolation to the right?
No. No moving averages are involved. This is a true polynomial regression. The curve is fit based on the closing prices of each candle.
Will this work with Heiken-Ashi candles?
Yes. It will work with any chart type (tick, candle, Heiken-Ashi, etc.) and on any time frame.
Below is a screenshot of a Heiken-Ashi chart.
 Loading... Please wait...


